Business Dashboard Software for Real-Time Insights
Webbo Insights is a powerful business dashboard software that helps companies track real-time analytics, monitor performance, and generate clear reports from their data.
- Connect to ERP, Excel & Databases
- Build Custom Dashboards in Minutes
- Share Reports with Your Team Instantly


Why Webbo Insights?
Create powerful dashboards in minutes for managers, employees, and every department — all in one place.
Quick Dashboard Creation
Create dashboards in minutes without technical skills — simple, fast, and ready to use.
Dashboards for Every Role
Give each manager, employee, and team their own dashboard with relevant data and KPIs.
Department-Based Insights
Track performance by department — sales, finance, operations, and more — all in one view.
Real-Time Data
See live updates instantly — no delays, no manual reports, no Excel dependency.
Fully Customizable
Customize dashboards, metrics, and reports based on your business needs.
Works Everywhere
Access dashboards on desktop, tablet, and mobile — anytime, anywhere.
Stop Guessing Your Numbers
Know exactly what’s happening in your business with a clear and simple dashboard.
Understand Your Business Clearly
Stop guessing your numbers. Get a clear view of your sales, profit, and performance in one simple dashboard designed to give you full control over your business.
Connect and Analyze Your Data
Upload your Excel files or connect your system . Instantly transform your raw data into meaningful insights and visual reports without any technical complexity.

Make Smarter Decisions Faster
Use real-time insights to identify trends, track performance, and take the right decisions at the right time to grow your business with confidence.
We are proud of the works we’ve done.
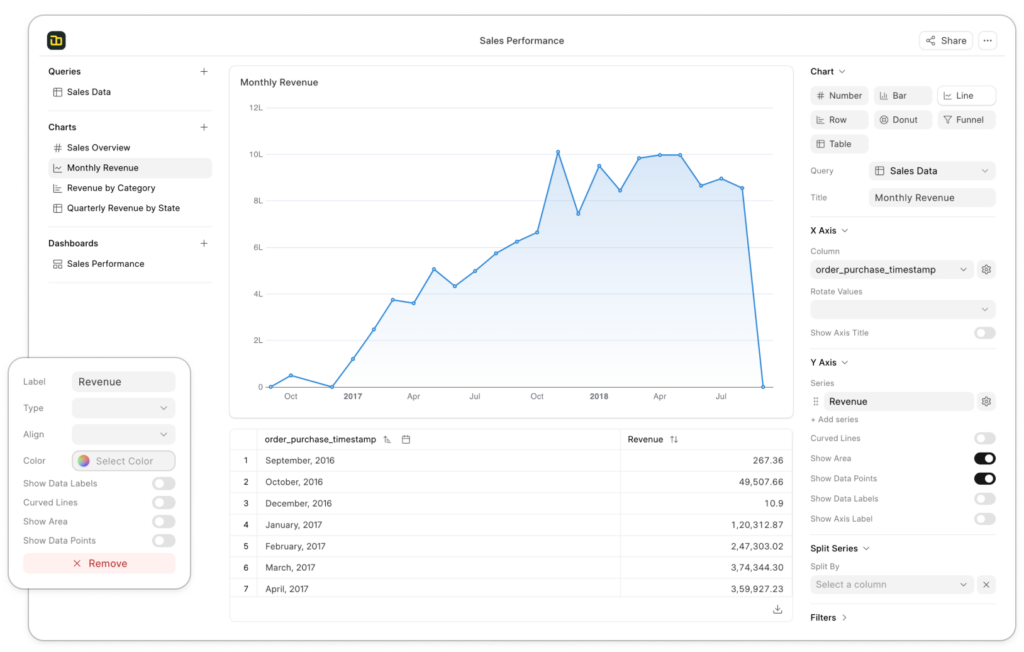
One Dashboard. Full Visibility.
Connect your data and instantly see performance, trends, and insights in one place.
- Sales tracking
- Profit analysis
- Performance insights
Real-Time Business Analytics
Turn Your Data into Powerful Dashboards
Watch how you can track sales, profit, and performance instantly using Webbo Insights — no complexity, just results.
How Webbo Insights Works
Turn your data into powerful dashboards in just 3 simple steps

Upload Data
Easily upload your Excel files or import your data from any source. No technical skills required.

Process Data
Webbo Insights automatically organizes and analyzes your data to generate clear and meaningful insights.

View Dashboard
Instantly access interactive dashboards to track sales, profit, and performance in real-time.
Simple and Flexible Pricing
Choose the perfect plan to turn your data into powerful business insights.
STARTER
Best for small businesses
- Upload Excel or CSV
- 1 Dashboard
- Basic charts
- Easy reports
BUSINESS
Best for growing teams
- Multiple data sources
- Up to 5 dashboards
- More charts and reports
- Connect database
PROFESSIONAL
Best for companies
- Multiple dashboards
- Advanced reports
- Team access
- Permissions control
ENTERPRISE
Organizations with complex data & security needs
- Full integration
- Advanced security
- User-level permissions
- Training and support
Frequently Asked Questions
Webbo Insights is a business analytics solution powered by Frappe Insights that helps you analyze your data, build dashboards, and make better decisions based on real information.
It allows you to connect your data, create queries, and visualize results in interactive dashboards.
You can connect multiple data sources including:
- ERPNext / Frappe applications
- Databases (MySQL, PostgreSQL, BigQuery)
- Excel and CSV files
All your data can be unified in one place for better analysis.
No. Webbo Insights provides a visual query builder that allows you to create reports without writing any code.
For advanced users, SQL queries can also be used for deeper analysis.
You can build interactive dashboards that include:
- Sales performance
- Financial reports
- Inventory insights
- Custom business metrics
Dashboards are created using charts, tables, and filters to give a clear view of your data.
Yes. Webbo Insights allows you to connect and analyze data from multiple sources and combine them into one dashboard for unified reporting.
Dashboards are built by:
- Creating queries from your data
- Converting results into charts
- Combining charts into a dashboard
All of this can be done using a simple drag-and-drop interface.
Yes. You can share dashboards with your team and control access based on users, roles, or teams.
This allows each department to view only the data relevant to them.
Yes. Webbo Insights uses secure database connections and supports permission-based access control, ensuring that users only see the data they are allowed to access.
Yes. Webbo Insights is designed for individuals, companies, and organizations of all sizes that want to understand their data and improve decision-making.
Most users can start using Webbo Insights within minutes after connecting their data.
For advanced setups, our team provides full onboarding and support.
Yes. Webbo provides:
- Data connection setup
- Custom dashboard design
- Business-specific reporting
- Training and onboarding
Because we don’t just provide a tool — we help you turn your data into clear, actionable insights that drive real business decisions.
Explore Full Documentation & Start Building Smarter Dashboards
Access complete guides to understand how Webbo Insights works — from connecting your data sources to creating powerful dashboards and reports.
Learn how to build, customize, and share insights across your organization with ease.
Trusted by growing
businesses and professionals